One of the most used browsers to explore the World Wide Web is Google Chrome. And one of their most essential tools for web developers is the Chrome DevTools. Present in most of the browsers in the market, DevTools is a set of web developer tools built directly into the browser. This proves to be extraordinarily important and has many great web design tips. [bctt tweet=”DevTools help the web developer edit pages on-the-fly and diagnose problems quickly, helping to build better websites faster.” username=”ThatCompanycom”]
Each browser has its specific set of DevTools wishing to be more attractive and usable to the web development environment. Two of these top fighter with great tools is Google Chrome and Firefox. For this blog, I will be mentioning some of the cools things that integrate Chrome DevTools, starting with Chrome 87 base on information resourced on the Google Developers Web Updates. The goal of this article is to open your eyes to more web design tips and hopefully improve your ability to manage your sites.
One of my favorite web design tips | the new CSS Grid debugging tools
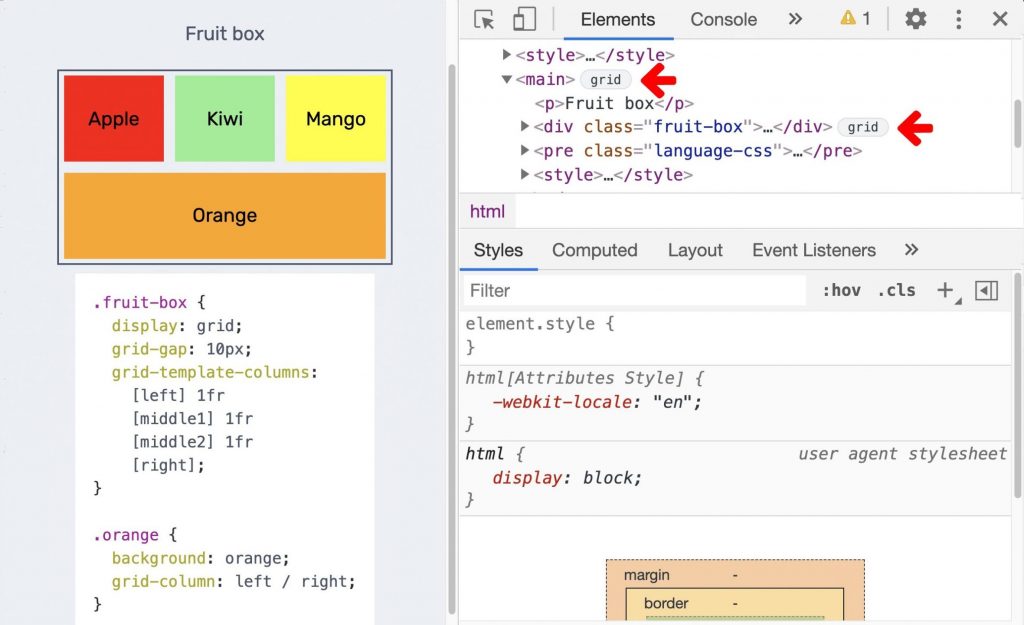
When an HTML element has display: grid or display: inline-grid applied to it, a grid badge next to it in the Elements panel is shown. Click the badge toggle to display a grid overlay on the page. The Layout pane has a Grid section offering you some options for viewing the grids.
New WebAuthn tab
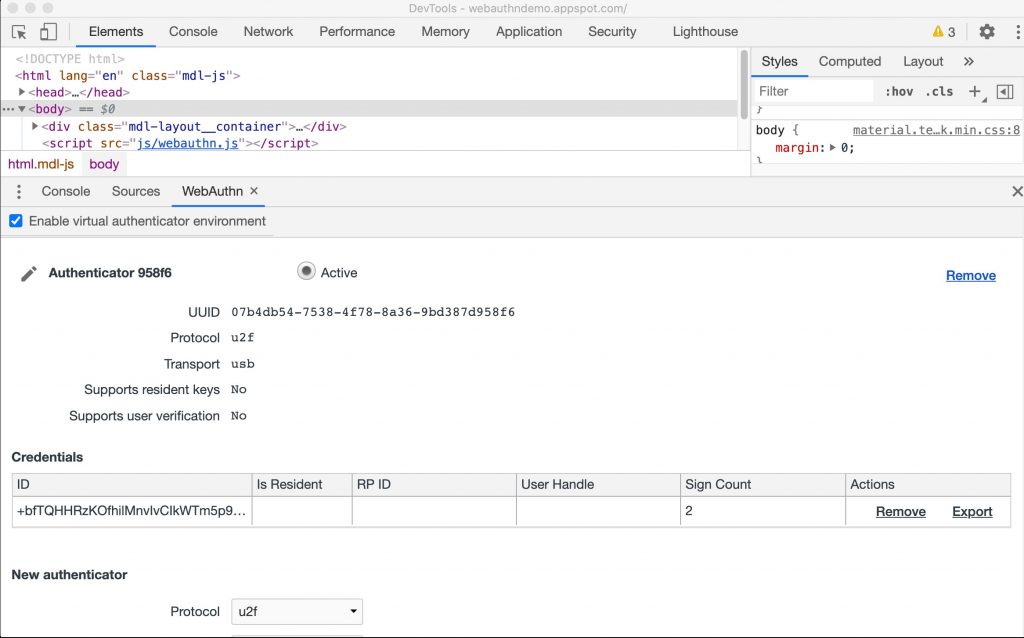
Use the WebAuthn tab in Chrome DevTools to create and interact with software-based virtual authenticators. You can emulate authenticators and debug the Web Authentication API with the new WebAuthn tab. Web developers can emulate these authenticators, customize their capabilities, and inspect their states, without the need of any physical authenticators. This makes the debugging experience much more manageable and can help dramatically in many aspects of web-building. That is why getting comfortable and understanding the new WebAuthn tab is on of the most crucial web design tips in this article.
Move DevTools between top and bottom panel
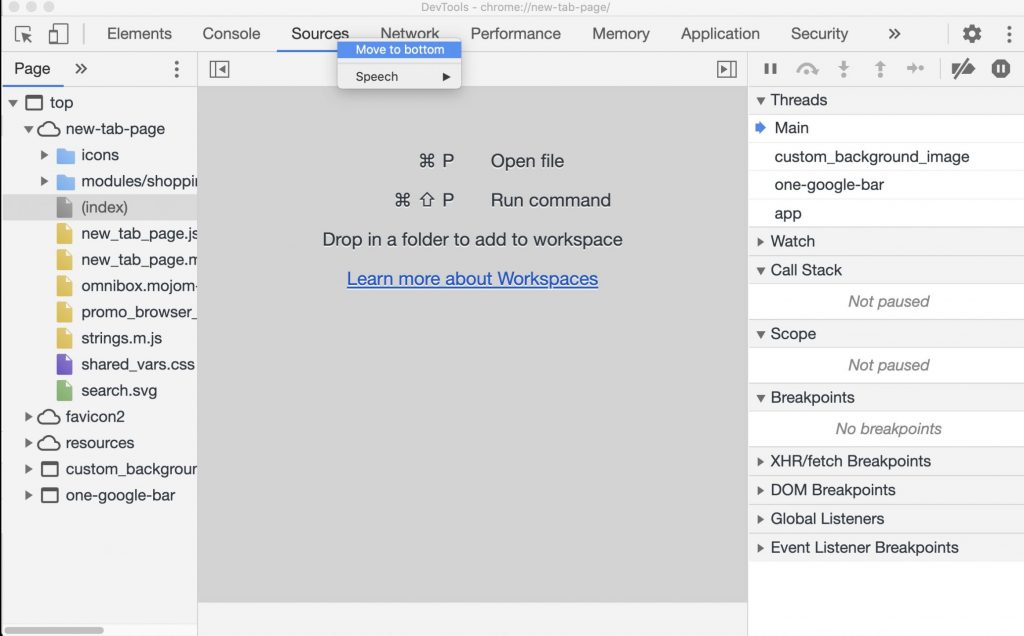
DevTools support moving tools between the top and bottom panel to view any two tools at once. If you would like to view the Elements and Sources panel at once, you can right-click on the Sources panel and select Move to bottom to move it to the bottom. You can also move any bottom tab to the top by right-clicking on a tab and choose Move to top.
This is just one of the DevTools you can utilize on your website. Below there will be more, but if you’re interested in white-label web-design, then you should consider clicking this link to learn everything you need to know about white label and allowing us to work with you on your website.
DevTools for Elements panel updates, and why it is one of the good web design tips
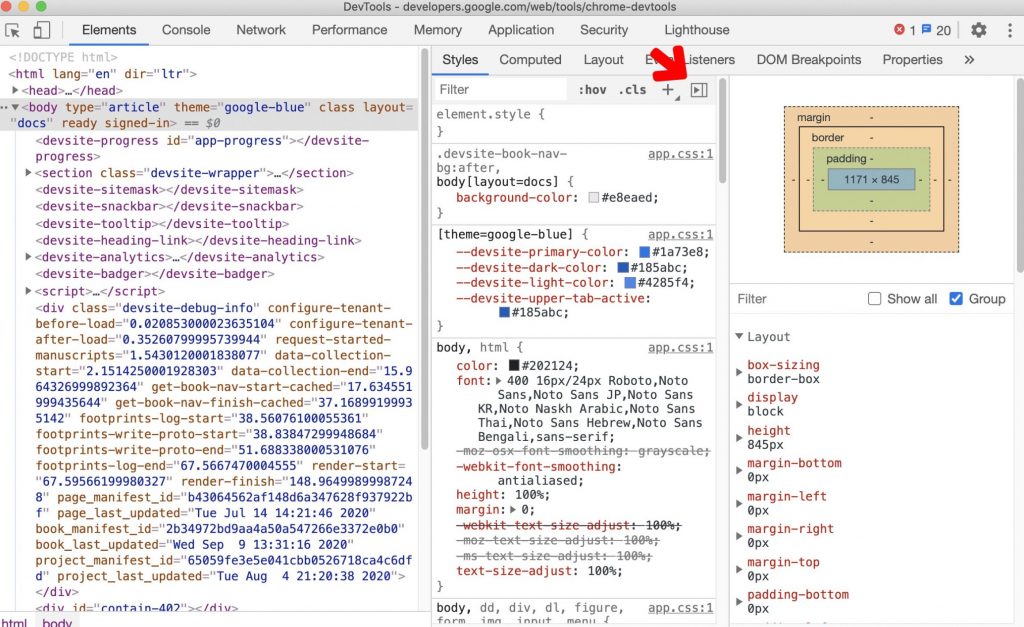
View the Computed sidebar pane in the Styles pane
The Computed sidebar pane in the Styles pane is collapsed by default. Click on the button to toggle it.
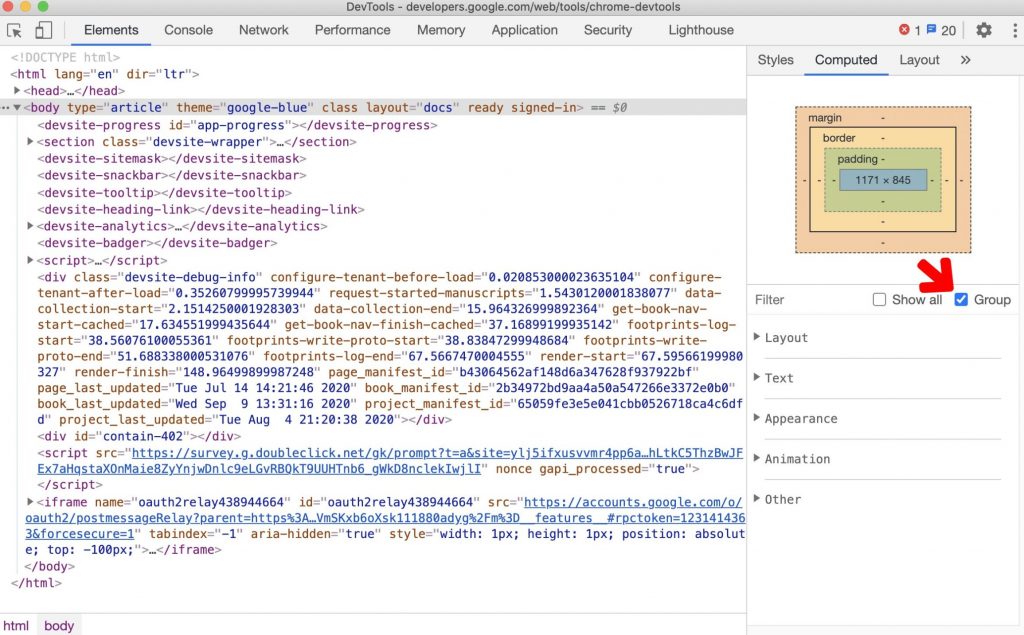
Grouping CSS properties in the Computed pane and how it is one of the good web design tips
You can group the CSS properties by categories in the Computed panel with DevTools. With the grouping feature, it’s simple to navigate in the Computed pane (less scrolling) and selectively focus on a set of related properties for CSS inspection. On the Elements panel, select an element, and then toggle the Group checkbox to group/ungroup the CSS properties. CSS is at the heart of web design, and understanding how to group properties can be one of many useful web design tips.
DevTools for Resource-type and URL filters in the Network panel,
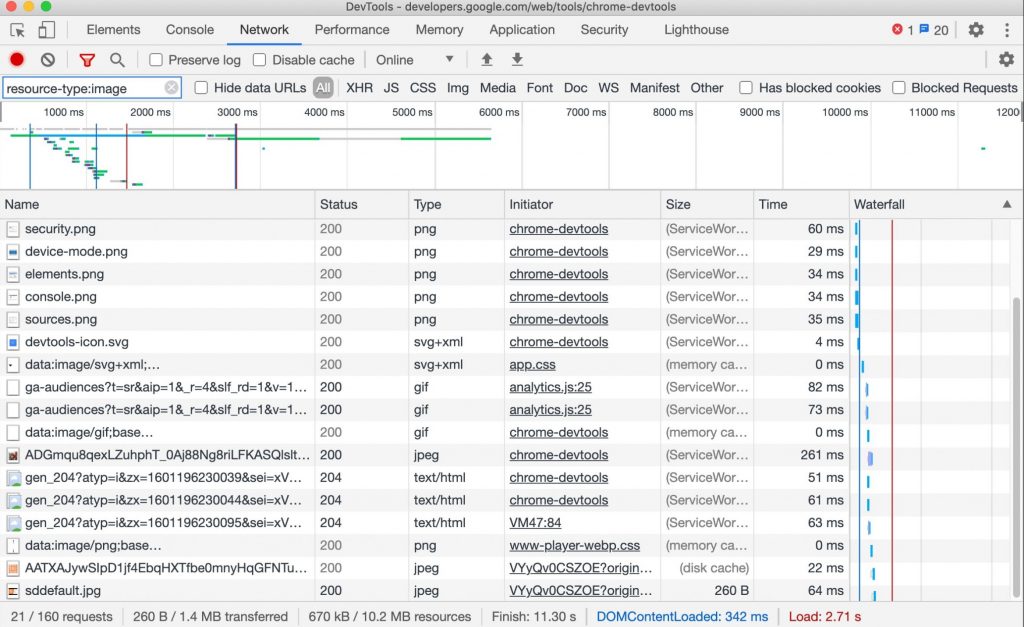
Use the resource-type and URL keywords in the Network panel to filter network requests. To focus on the network requests that are images, use resource-type: image. Use the Filter text box to filter requests by properties, such as the domain or size of the request. You can use multiple properties simultaneously by separating each property with space. These multi-property filters are equivalent to AND operations. OR operations are currently not supported.
Deprecation of Settings in the More tools menu
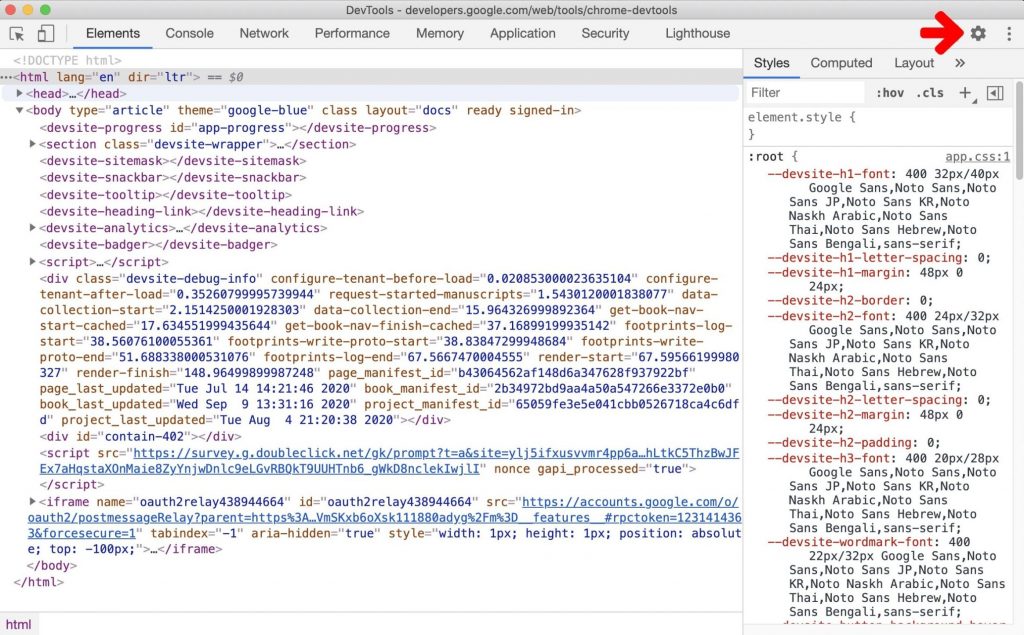
Settings in the More tools menu were deprecated, and now you open the Settings from the main panel instead.
If you’re looking for even more tips on your website, click this upcoming link for 5 amazing tips for web design.
Color contrast issues view and fix in the CSS Overview panel and why it is one of the essential web design tips
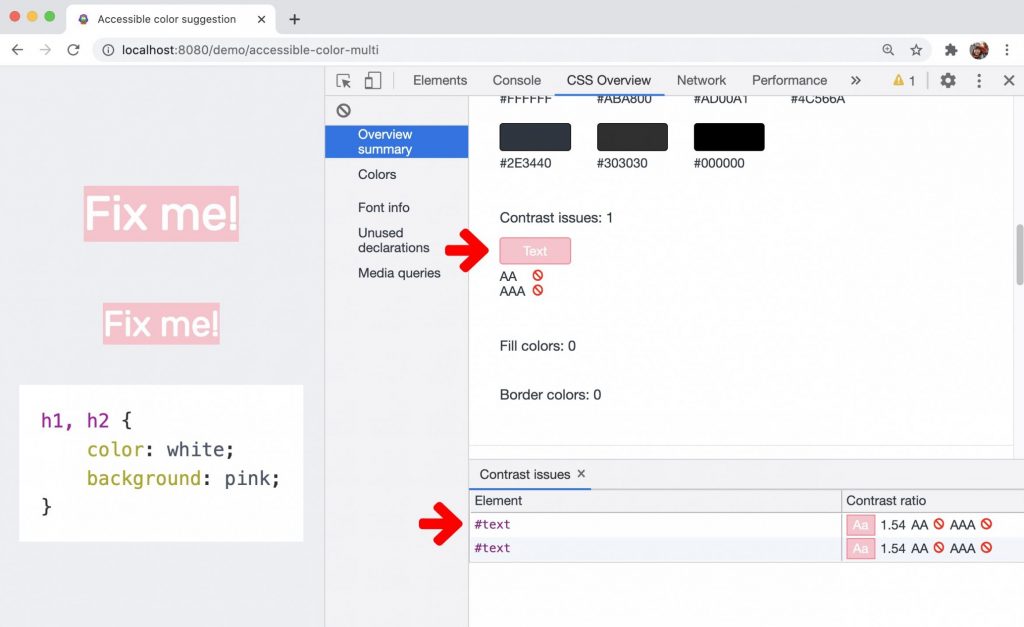
CSS Overview panel displays a list of low color contrast texts on your page. Click on the issue, and a list of elements that have an issue will be listed. On the list, click on an element to open the element in the Elements panel. DevTools provides auto color suggestions to help you fix the low contrast text. Getting a proper color contrast is crucial, and hopefully, this is one of the web design tips that can help you improve your website’s look.
Making Use of DevTools and the New Media panel
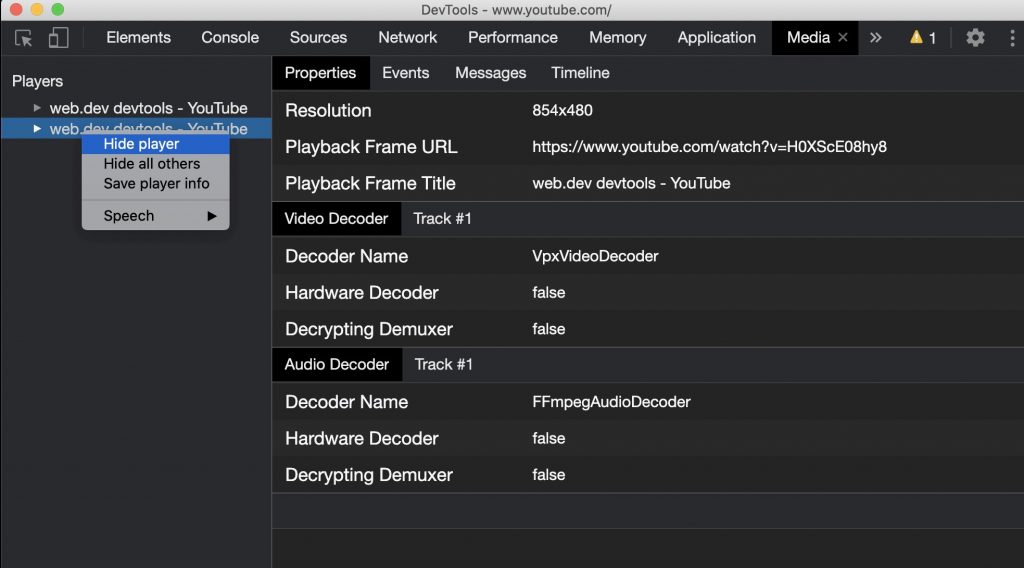
DevTools now displays media player’s information in the Media panel. Before the media panel in DevTools, logging and debug information about video players could be found in chrome://media-internals. The Media panel provides a simple way to view events, logs, properties, and a timeline of frame decodes in the same browser tab as the video player itself. You can live view and inspect potential issues quicker (e.g., why dropped frames are occurring, why JavaScript is interacting with the player unexpectedly). This improvement on the user interaction with your website will lead to a better experience for the user. Hopefully, this is one of the web design tips you find useful.
Capture node screenshots via the Elements panel context menu. More web design tips
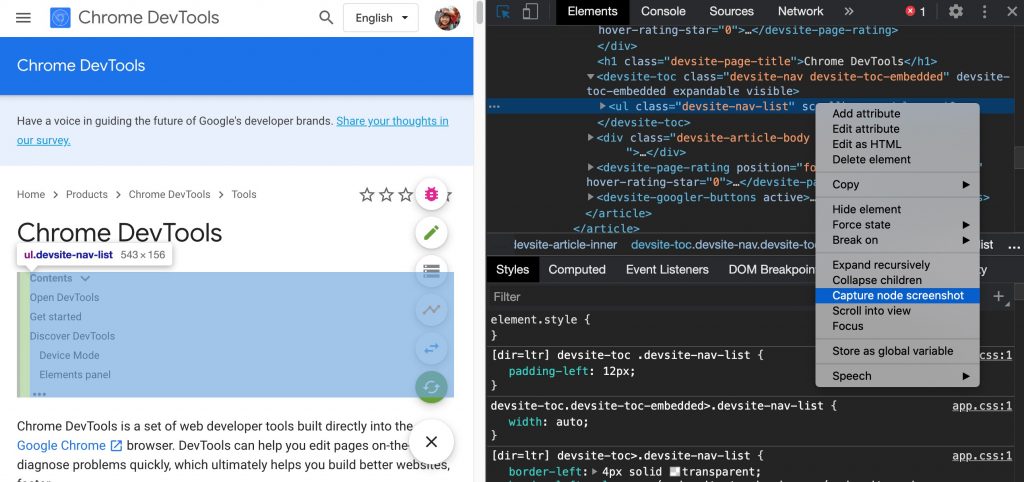
You can now capture node screenshots via the context menu in the Elements panel thanks to DevTools. You can take a screenshot of a component on a webpage by right-clicking the element and select Capture node screenshot.
Support for new JavaScript features
DevTools has improved the support for some latest JavaScript language features:
- Syntax highlighting for private fields – private class fields are now properly syntax-highlighted and pretty-printed in the Sources panel.
- Pretty-print numeric separators – DevTools properly pretty-prints the numeric separators in the Sources panel.
- Optional chaining syntax autocompletion – property auto-completion in the Console now supports optional chaining syntax, e.g., name?. now works in addition to and name[.
- Logical assignment operators – DevTools supports logical assignment with the new operators &&=, ||=, and ??= in the Console and Sources panels.
- Syntax highlighting for Nullish coalescing operator – DevTools now properly pretty-prints the nullish coalescing operator in the Sources panel.
New icons for breakpoints, conditional breakpoints, and logpoints
![]()
The Sources panel has new designs for breakpoints, conditional breakpoints, and logpoints. Breakpoints get a refreshed flag design with brighter and friendlier colors. Icons are added to differentiate conditional breakpoints and logpoints. This is a neat and great feature of Chrome DevTools.
Performance panel updates
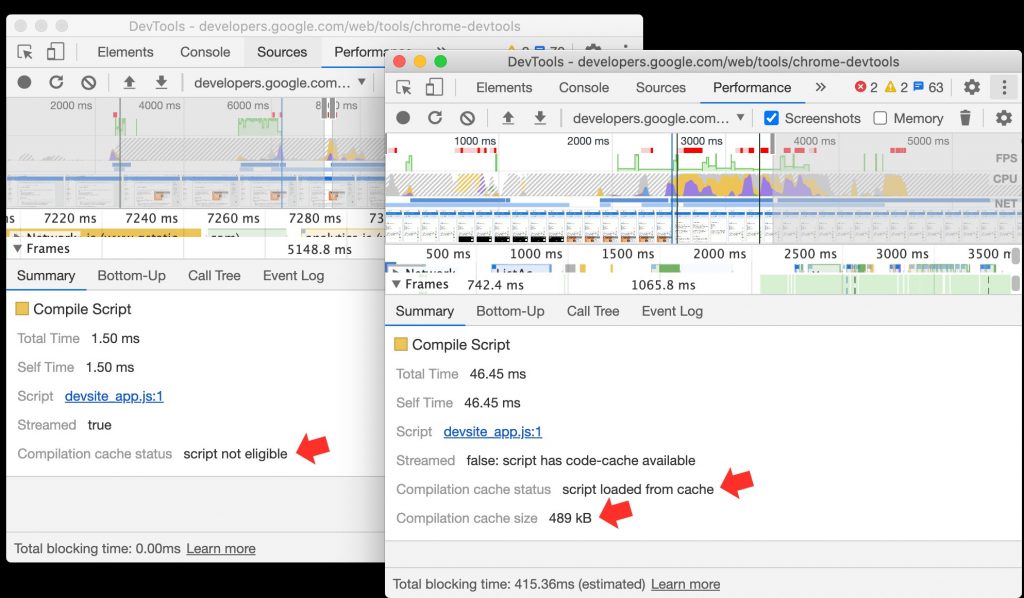
JavaScript compilation cache information in the Performance panel
Previously, DevTools wouldn’t show anything related to code caching if code caching didn’t happen. Today, JavaScript compilation cache information is always displayed in the Summary tab of the Performance panel.
Navigation timing alignment in the Performance panel
Before, the Performance panel used to showtimes in the rulers based on when the recording started. Now, it shows times for recordings where the user navigates, where DevTools now show ruler times relative to the navigation instead. Also, the times for DOMContentLoaded, First Paint, First Contentful Paint, and Largest Contentful Paint events were updated to be more relative to the start of the navigation, which means they match the timings reported by PerformanceObserver.
It is not a complete list of all the DevTools and web design tips…
I have listed some of the cools things that the Chrome DevTools offers to us as web developers, and for sure, there should be other more exciting things not listed here. Nor does this list all of the web design tips that would be useful to you. That would be redundant. The idea is to create an interest in using the browser DevTools and explore the different tools in each of the available browsers in the market. DevTools is a fantastic tool. There’s nothing to install.
Need help with your website? You should consider using our white label web design services. Also, make sure to contact us to let us know what you think of the article and if it has helped you learn more about Chrome DevTools.


